

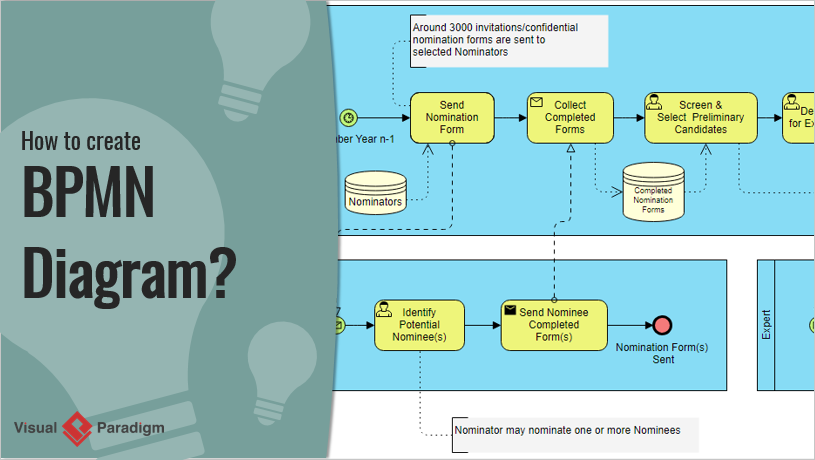
How to Create BPMN Diagram?
A Business Process Model and Notation (BPMN) diagram is a graphical representation of a business process or workflow. BPMN diagrams are widely used in the business process management field to help organizations streamline their operations and improve efficiency. In this tutorial, you will learn what BPMN is, what the common BPMN symbols are, and finally, you’ll learn how to create a BPMN diagram step-by-step using Visual Paradigm. So, let’s get started!
What is BPMN diagram?
A Business Process Model and Notation (BPMN) diagram, aka business process diagram, is a kind of flow chart that uses standard BPMN symbols to represent the activities, events, and flows involved in a business process.
The primary goal of BPMN is to provide a standardized notation that can be used by different stakeholders, including business analysts, process owners, developers, and executives, to understand, improve, and communicate business processes. By using BPMN, organizations can streamline their operations, identify areas for optimization, and ultimately improve their overall efficiency and effectiveness.
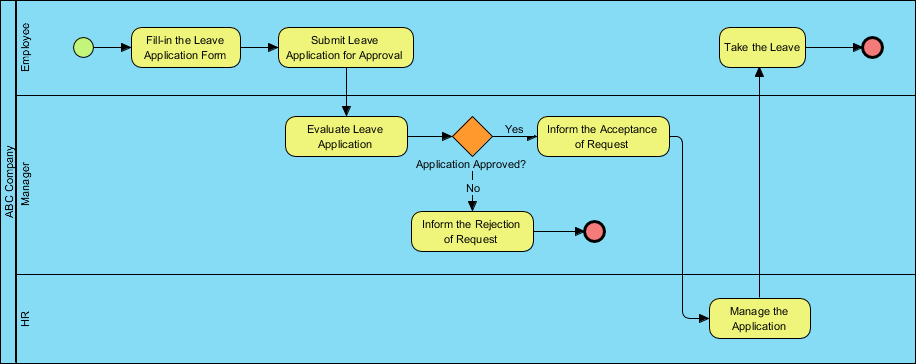
The figure below shows an example BPMN diagram that represents the flow of applying for sick leave
Purpose of BPMN Diagram
The simplicity of BPMN symbols makes them accessible to a wide range of stakeholders, from business analysts and technical developers to business managers and non-technical stakeholders. BPMN serves as an effective communication tool by providing a common and straightforward visual language to specify business processes, which helps to prevent miscommunication among different parties.

BPMN symbols
There are five basic categories of BPMN elements.
Flow objects
The primary category is Flow Objects, which consists of three types: Events, Activities, and Gateways.
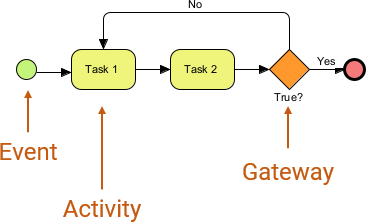
Events are points in the process that indicate the start or end of a process, while Activities represent tasks that are performed as part of the process. Gateways are used to control the flow of the process based on conditions or decisions.
Data
Data Objects represent information used by the process and include four types: Data Objects, Data Inputs, Data Outputs, and Data Stores.
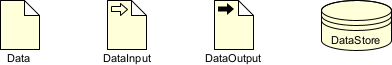
Data Objects represent data needed for a task, while Data Inputs and Outputs represent data that is input or output from a task. Data Stores represent a location where data is stored for later use.
Connecting Objects
Connecting Objects are used to link Flow Objects and Data Objects and include four types: Sequence Flows, Message Flows, Associations, and Data Associations.
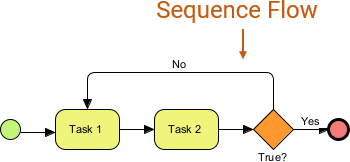
Sequence Flows represent the order in which activities are performed, while Message Flows represent the exchange of information between two participants. Associations connect data or text annotations to a Flow Object or Data Object, and Data Associations connect data to a Data Object.
Swimlanes
Swimlanes are used to group primary modeling elements and consist of two types: Pools and Lanes.
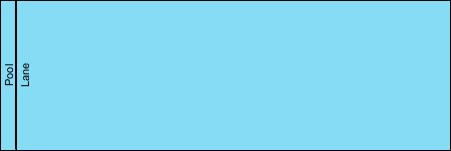
Pools represent a participant in a process, while Lanes represent sub-divisions within a participant.
Artifacts
Artifacts provide additional information about the process and include two standardized types: Group and Text Annotation.
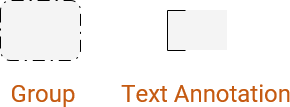
Group allows elements to be grouped together for clarity, while Text Annotation provides additional information or clarification about an element.
How to draw a BPMN diagram with Visual Paradigm?
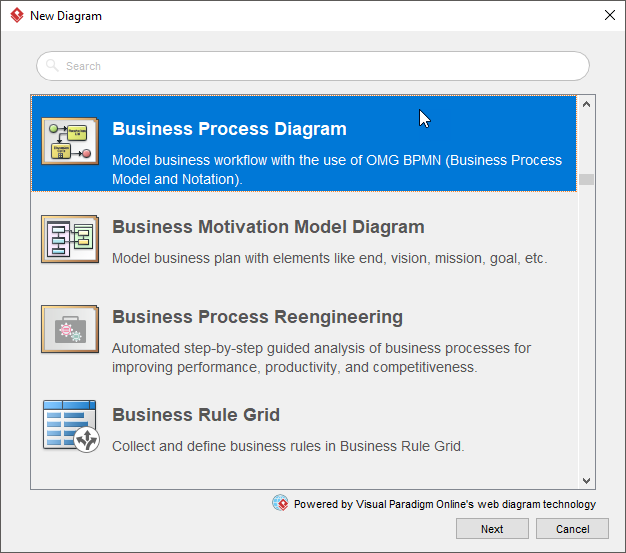
- Open the Visual Paradigm application and select Diagram > New from the main menu.
- In the New Diagram window, choose Business Process Diagram and click Next.
- Select Blank to create a BPMN diagram from scratch, and click Next.
- Enter the diagram name and click OK.
- Drag and drop shapes from the diagram toolbar to start building your diagram.
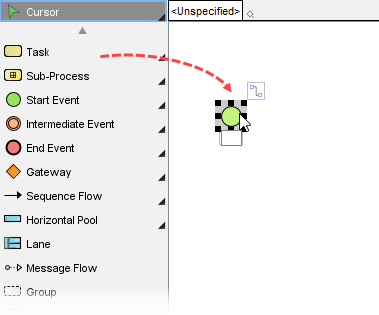
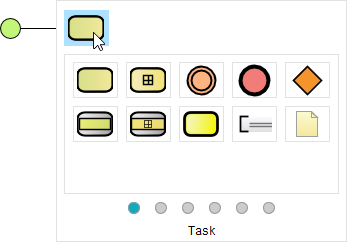
- Use the Resource Catalog to add more shapes to your diagram. Simply move your mouse over a shape, click on the resource icon, and drag it out to create the shape. A connector will be automatically created for you.
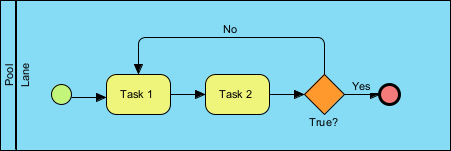
- Continue adding shapes and connectors until your diagram is complete. You can refer to the sample diagram provided below for inspiration.
- When your diagram is complete, you can export it as an image in various formats (JPG, PNG, PDF, SVG, etc.) to share with your friends or co-workers. Simply go to Project > Export > Active Diagram as Image.