BPMN Process Simulation Example
Simulation is a powerful technique that enables business analysts to replicate the execution of a business process and study the resource consumption, such as human resources and devices, throughout the process. By identifying bottlenecks and areas for improvement, simulation can help refine the current business process and reallocate resources for better efficiency. The simulation tool provides visual simulation capabilities as well as functions to generate charts and reports.
In this tutorial, we will explore the business process of performing a body check and utilize the simulation tool to identify potential changes that can make the process more efficient. By leveraging the insights gained from simulation, we can optimize the process for better performance and outcomes.
What is business process simulation?
Simulation in Business Process Diagram (BPD) is a technique that uses computer models to mimic the execution of a business process in a virtual environment. It allows business analysts to study the behavior of a process, test different scenarios, and predict the impact of changes on the process performance without actually executing the process in a real-world setting.
Simulation in BPD can be used to identify potential bottlenecks, inefficiencies, and errors in the process and to optimize and streamline the process for better performance and outcomes. It can also help in resource allocation by providing insights into how resources (e.g. human resources, devices) are utilized throughout the process.
Performing business process simulation with Visual Paradigm
- Download Body Check.vpp. You can also find this file at the bottom of this tutorial.
- Open the downloaded .vpp file in Visual Paradigm. To open a project, select Project > Open from the application toolbar.
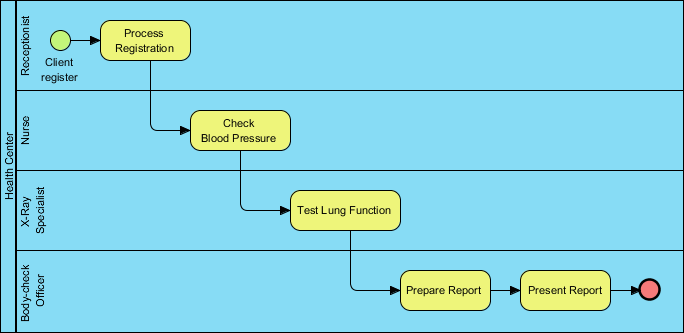
- Open the business process diagram A cycle of body check.
- Study the process. The diagram models the current process of performing body check in a health center. It starts from processing a client’s registration by receptionist, then the nurse check the client’s blood pressure, the X-Ray specialist test the client’s lung function, and finally the body-check officer prepare a report and present it to user.
Now, we want to know the answer of the following questions, which simulation can help:- How long it takes to finish a process?
- What is the optimal allocation of resources like staff (e.g. specialist), rooms (e.g. Meeting room) or devices/machines (e.g. X-Ray machine)?
- Does the process works well against a large amount of clients?
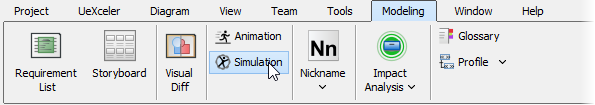
- In order to run simulation, we need to provide additional information to the business process diagram, such as the current resource consumptions and durations of each activity. Select Modeling > Simulation from the application toolbar. The Simulation Control Panel will appear for you to set simulation details like resource consumption and duration of activities.
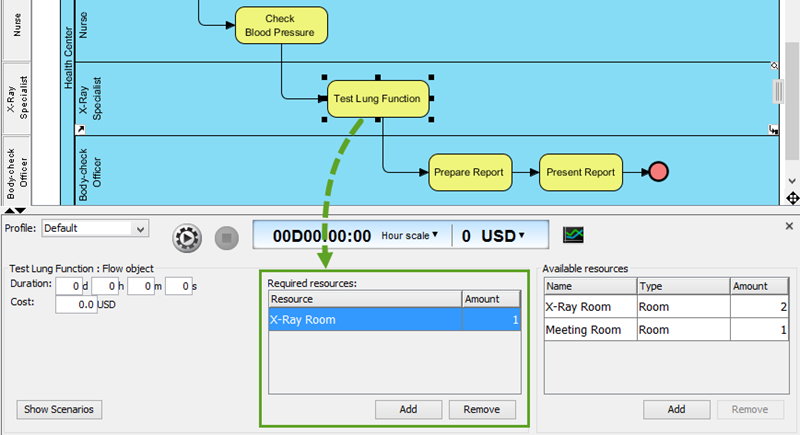
- Let’s start by recording the resource consumption of the current process. On the right hand side of the diagram you can configure the resources that is available to the process. Available resources mean the resources that can be used, but not necessarily be used. For example, the health center may have 20 wheelchairs available, while only 5 to 6 is needed. Now, click Add to add an available resource X-Ray Room, typed Room with 2 as amount. Add also a resource Meeting Room, typed Room with 1 as amount. Other resources like wheelchairs, toilets are irrelevant to the process, and can be ignored.

- The testing of lung function need to be done in an X-Ray room. Select task Test Lung Function in diagram. At the Simulation Control Panel click Add for Required Resources and select X-Ray Room from the popup menu. Keep amount be 1 as only one room is needed to perform a lung function testing.
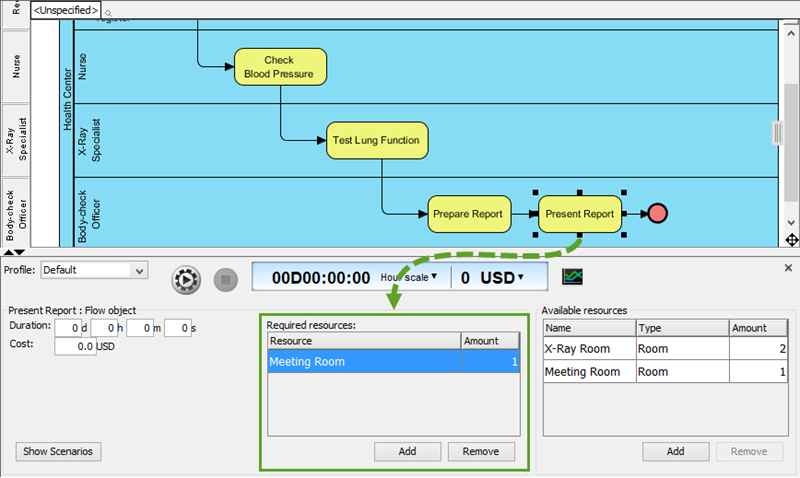
- Select the task Present Report. Add Meeting Room as a required resource with 1 as amount.
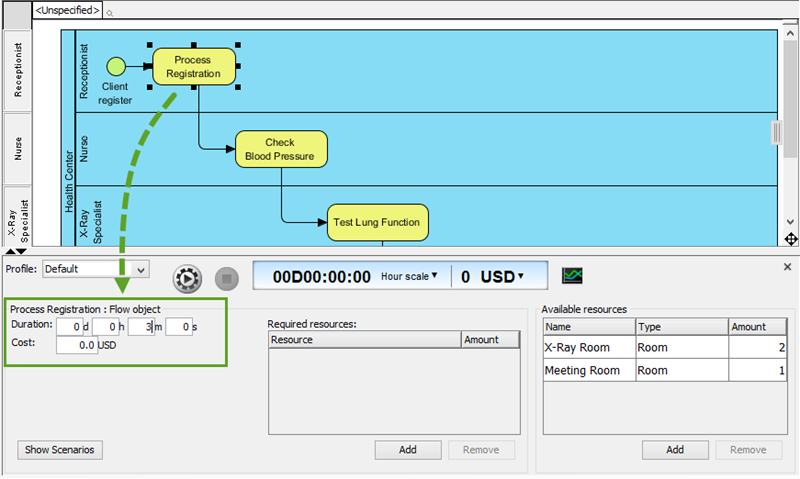
- We also need to set the duration of completing each task. Select task Process Registration. Set at the Simulation Control Panel its duration to be 3, meaning that it takes 3 minutes to complete a registration process.
- Set the duration of other tasks.
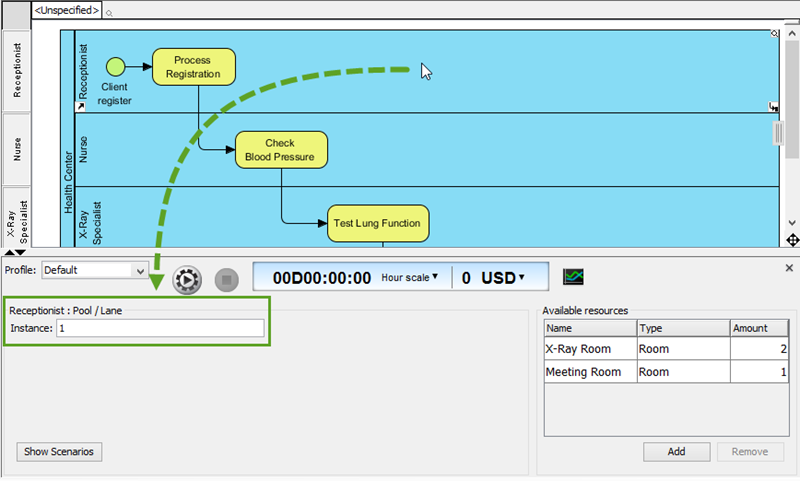
Task Duration Check Blood Pressure 2 minutes Test Lung Function 6 minutes Prepare Report 2 minutes Present Report 5 minutes - The lanes such as Receptionist, Nurse, etc are the participants of the body check process. They are also resources that can affect the efficiency of process. We need to set the number of each lane. Select lane Receptionist in diagram and set instance to be 1 at the Simulation Control Panel. This mean that one and only one receptionist is taking part in this process.
- Set the instances of other lanes.
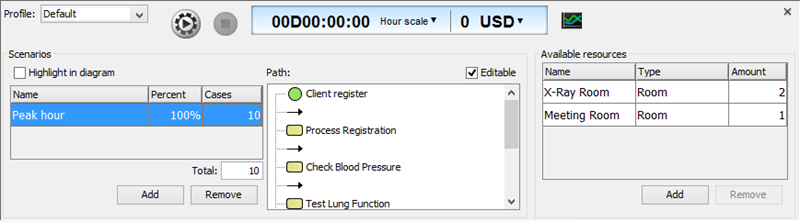
Lane Instance Nurse 1 X-Ray Specialist 1 Body-check Officer 1 - Click Show Scenario at the Simulation Control Panel. Scenarios are ways of running through the process. If a process contains gateways, you can define multiple scenarios to represent the execution of different paths due to the forking.
- Take this process as example. Click Add to add an input, with name Peak hour, 10 as instances. This means that at peak hour(s), there will be 10 clients who need to perform body check. With this setting, the path (as presented in the Path list) will be executed 10 times during process simulation.
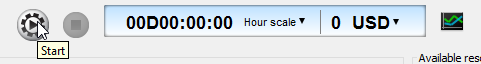
- Click the Start button to start process simulation.
- Study the result of simulation. Below is a description of some of the key area that you should pay attention to:
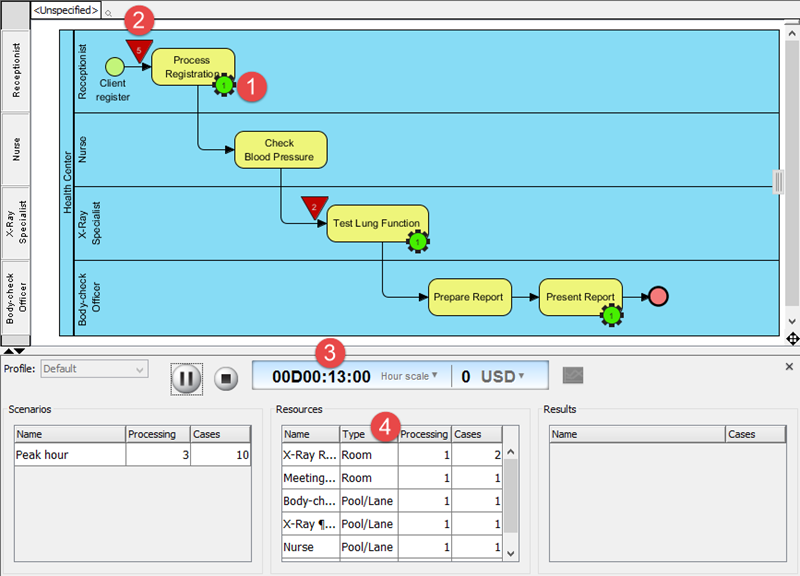
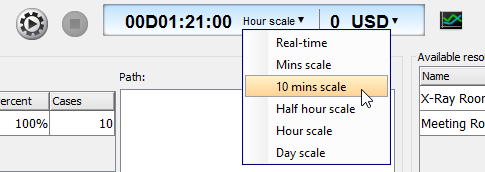
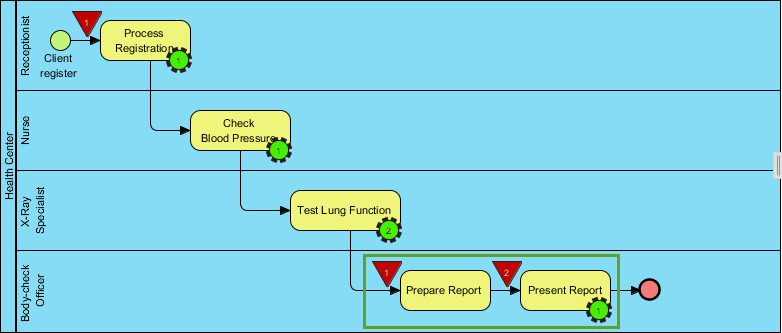
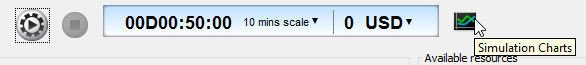
No. Description 1 The green running circle stands for job(s) that is/are executing at the attaching task/activity. The number inside the circle stands for the number of jobs being executed. 2 The red inverted triangle stands for job(s) that is waiting to be executed. The number inside the triangle stands for the number of pending jobs. It is attached to the end of flow to represent the need of being executed by the coming flow object. 3 The clock shows the time elapsed. 4 The Resources table show the dynamic resource consumption. It will be updated throughout the process simulation to reflect the use of resources at particular instant. - It looks like the simulation process is a bit too fast. Click Stop. Change the scale to 10 mins scale and play again.
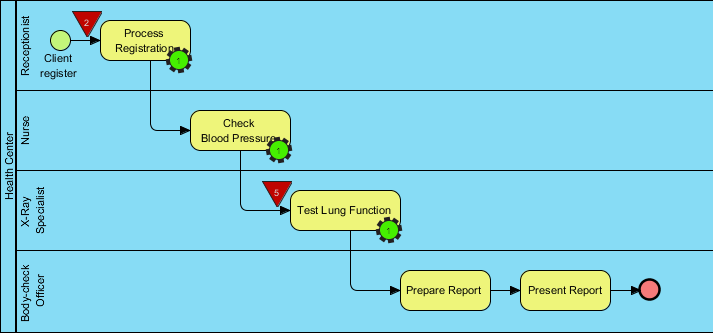
- It’s a bit slower now. By observing the occurrence of inverted triangle, we can determine where the bottleneck occur, if any, and to think of the possible improvements in further. With this body check process, we notice there are always pending jobs at task Test Lung Function.
- Now, we need to decide how to improve the process. Since the bottleneck is at lung function testing, we need to decide how to speed it up. There are several possible actions we can do:
- Reduce the duration of lung function testing
- Employ more specialist(s) to share the work load
Since the duration of proper lung function testing is fixed, the first action is impossible. We shall take the second action.
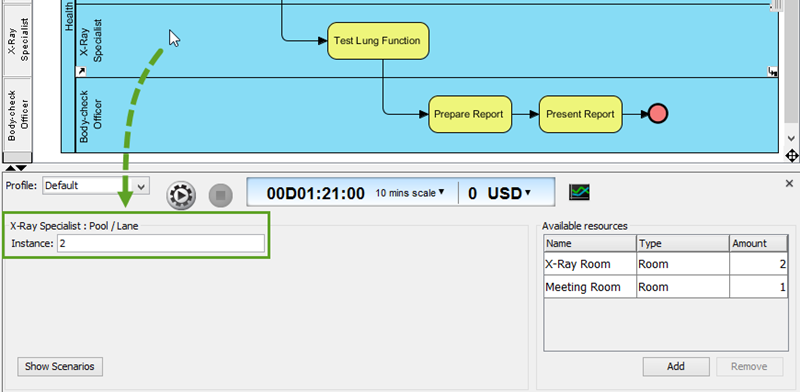
- Select lane X-Ray Specialist, change instance from 1 to 2.
- Click Start to simulate again.
- Strangely, the time it takes to finish the process remain the same, why? If you observe the result of simulation, you can see that the task Test Lung Function is no longer the bottleneck, due to the addition of X-Ray specialist. However, the tasks Prepare Report and Present Report now become the bottleneck.
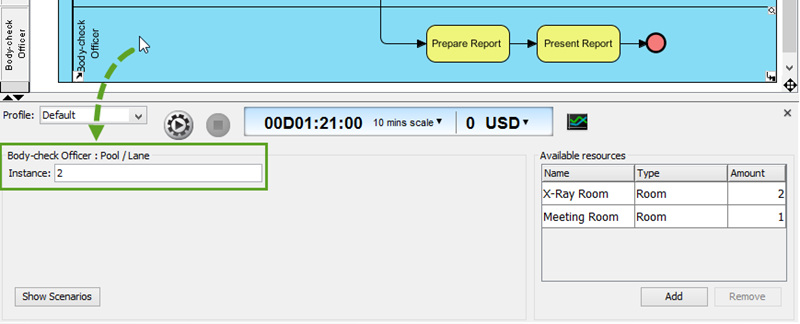
- Let’s employ one more body check officer to help. Select lane Body-check Officer, change instance from 1 to 2.
- Further to employing an officer to help, we need to reserve one more meeting room. Change the amount of available meeting room from 1 to 2.
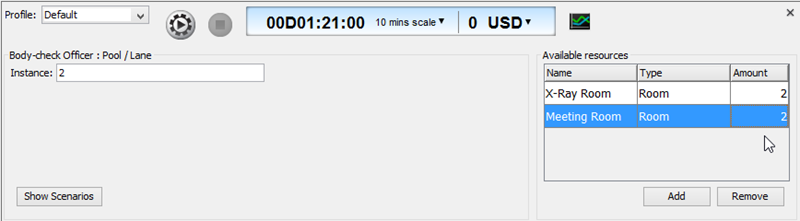
- Simulate again.
- It now takes 50 minutes to complete the whole process. By comparing with the original process, the improvements reduce 30 minutes operation time in total.
There are other possible solutions instead of employing more staff. For example, we can computerize the process by not presenting report to client, but to print it out with clear description on each checked item, and let the client read himself. We may also buy advanced X-Ray machines to speed up the lung function testing process. Simulation does not recommend a solution to you, but to let you execute your idea of improvements easily through updating diagram content and resource allocation, and give you figures to show the effect of changes, to help you decide the best solution. - Sometimes, just by watching the simulation outcome is not enough in finding out the bottleneck, especially when the diagram is large, and have many, many bottlenecks. In such cases, you can produce charts for simulation outcome, which helps quantify resource consumption and queuing time for each activity. Click Simulation Charts in Simulation Control Panel.
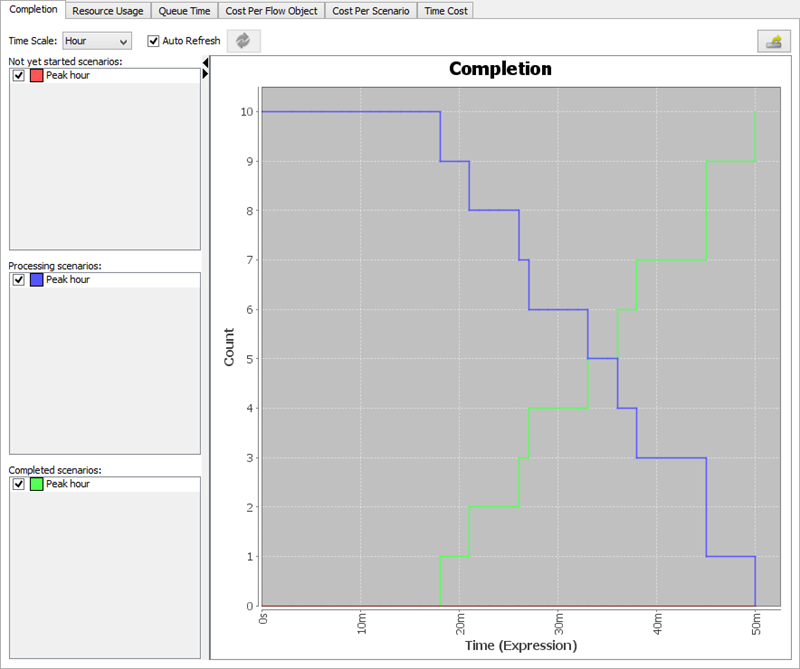
- Study the chart in Completion page. The chart show the status of scenarios completion against time. Remember we have set 10 instances to scenario Peak hour? From the chart you can see the completion of the 10 instances throughout the process simulation. As time goes by, there will be more scenarios being completed, and less scenarios being processing.
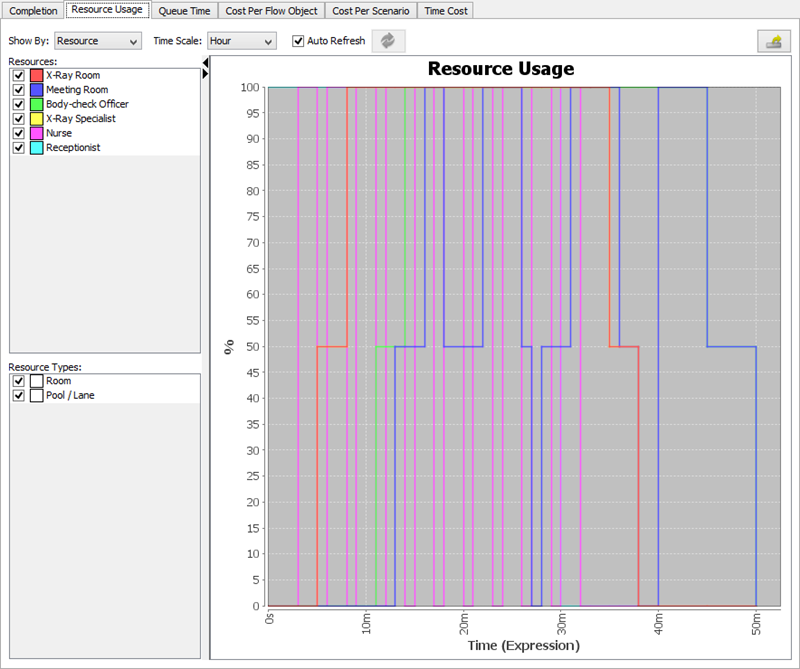
- Open the Resource Usage page. The chart here shows the level of resource consumption. In this example, both X-Ray room and meeting room are fully used (100%) within the process, which is ideal. But if you try to add 3 to 4 available X-Ray rooms, and review the chart, you will see that the peak usage will be less than 100% because some rooms are idles throughout the whole process. By studying this chart, you can adjust the amount of resources to apply to the process.
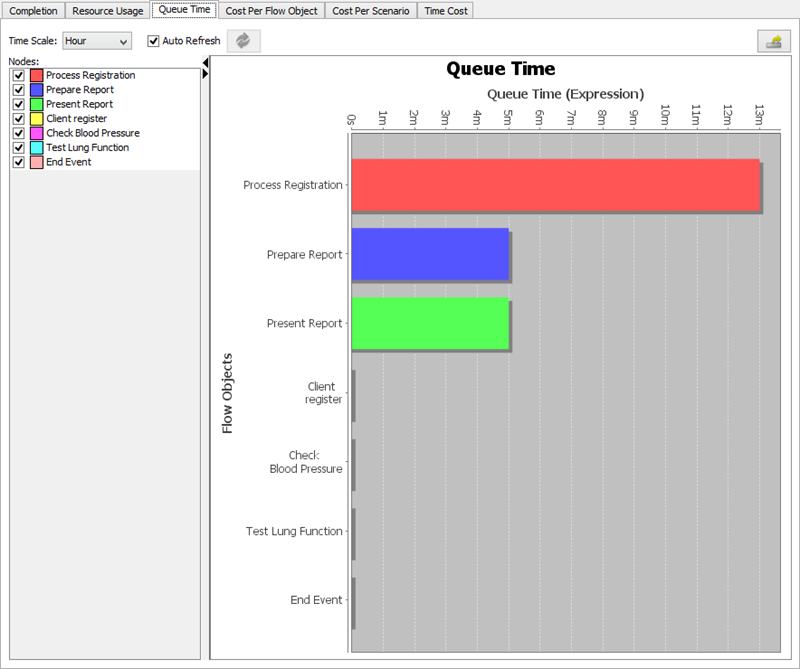
- Open the Queue Time page. The chart here shows the time the flow objects spent on waiting, which corresponds to the time an inverted triangle appear during simulation. By studying the chart, we know that process registration now takes over 10 minutes in waiting, prepare and present report still take over 4 minutes after the improvement. By studying this chart, you can decide whether further improvements need to be carried out.